
 Data Structure
 Networking
 RDBMS
RDBMS Operating System
 Java
Java MS Excel
 iOS
iOS HTML
HTML CSS
CSS Android
 Python
 C Programming
 C++
C++ C#
C# MongoDB
 MySQL
MySQL Javascript
 PHP
PHP
- Selected Reading
- UPSC IAS Exams Notes
- Developer's Best Practices
- Questions and Answers
- Effective Resume Writing
- HR Interview Questions
- Computer Glossary
- Who is Who
Color quantization in an image using K-means in OpenCV Python?
In the process of Color Quantization the number of colors used in an image is reduced. One reason to do so is to reduce the memory. Sometimes, some devices can produce only a limited number of colors. In these cases, color quantization is performed. We use cv2.kmeans() to apply k-means clustering for color quantization.
Steps
To implement color quantization in an image using K-means clustering, you could follow the steps given below ?
Import required libraries OpenCV and NumPy. Make sure you have already installed them.
Read two input images using cv2.imread() method. Specify the full path of the image. Reshape the image to an array of Mx3 size (M is the total number of pixels in image). Convert the image dtype to np.float32.
Define the iteration termination criteria (criteria), number of clusters(K) and apply the K-means clustering algorithm (cv2.kmeans()). Pass the flag cv2.KMEANS_RANDOM_CENTERS or cv.KMEANS_PP_CENTERS to specify how initial centers are taken.
Now convert back into uint8 and make the resulting image with a specified number of colors (K) by applying centroid values to all pixels.
Display the resulting image.
Let's look at some examples to implement color quantization in an image using K-means clustering.
Input Image
We will use this image as the input file in the examples below.

Example
In the Python code below we perform color quantization in the input image using the K-means clustering algorithm with K=8.
# import required libraries
import numpy as np
import cv2

# read input image
img = cv2.imread('horizon.jpg')
z = img.reshape((-1,3))

# convert to np.float32
z = np.float32(z)

# define criteria, number of clusters(K) and apply kmeans()
criteria = (cv2.TERM_CRITERIA_EPS + cv2.TERM_CRITERIA_MAX_ITER, 10, 1.0)
K = 8
ret,label,center=cv2.kmeans(z,K,None,criteria,10,cv2.KMEANS_RANDOM_CENTERS)

# Convert back into uint8, and make original image
center = np.uint8(center)
res = center[label.flatten()]
res2 = res.reshape((img.shape))

# display the image
cv2.imshow('Image with K=8',res2)
cv2.waitKey(0)
cv2.destroyAllWindows()
Output
When you run the above Python program, it will produce the following output window ?
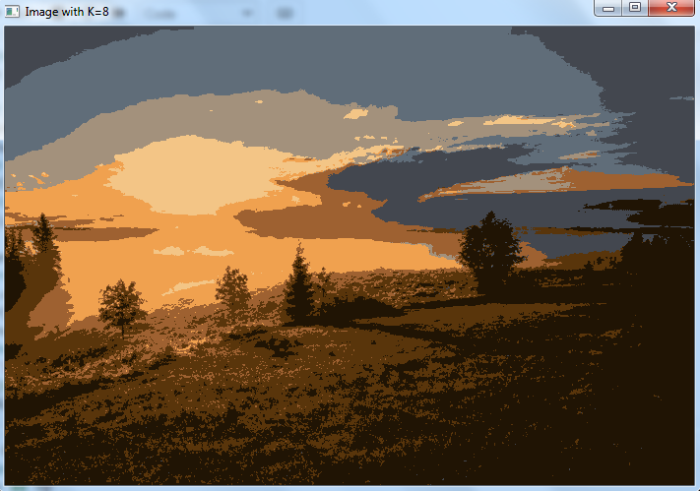
Notice that in the above output image the number of colors used is reduced to 8 as we used K=8.
Example
In the following Python code, we perform color quantization in the input image using the K-means clustering algorithm with different K values (K=2, K=5, and K=8).
# import required libraries
import numpy as np
import cv2
import matplotlib.pyplot as plt

# read input image
img = cv2.imread('horizon.jpg')
Z = img.reshape((-1,3))

# convert to np.float32
Z = np.float32(Z)

# define criteria, number of clusters(K) and apply kmeans()
criteria = (cv2.TERM_CRITERIA_EPS + cv2.TERM_CRITERIA_MAX_ITER, 10, 1.0)
def colorQuant(Z, K, criteria):

   ret,label,center=cv2.kmeans(Z,K,None,criteria,10,cv2.KMEANS_RANDOM_CENTERS)

   # Now convert back into uint8, and make original image
   center = np.uint8(center)
   res = center[label.flatten()]
   res2 = res.reshape((img.shape))
   return res2
res1 = colorQuant(Z, 2, criteria)
res2 = colorQuant(Z, 5, criteria)
res3 = colorQuant(Z, 8, criteria)

plt.subplot(221),plt.imshow(cv2.cvtColor(img, cv2.COLOR_BGR2RGB))
plt.title('Original Image'), plt.xticks([]), plt.yticks([])

plt.subplot(222),plt.imshow(cv2.cvtColor(res1, cv2.COLOR_BGR2RGB))
plt.title('K=2'), plt.xticks([]), plt.yticks([])

plt.subplot(223),plt.imshow(cv2.cvtColor(res2, cv2.COLOR_BGR2RGB))
plt.title('K=4'), plt.xticks([]), plt.yticks([])

plt.subplot(224),plt.imshow(cv2.cvtColor(res3, cv2.COLOR_BGR2RGB))
plt.title('K=8'), plt.xticks([]), plt.yticks([])
plt.show()
Output
When you execute the above code, it will produce the following output ?
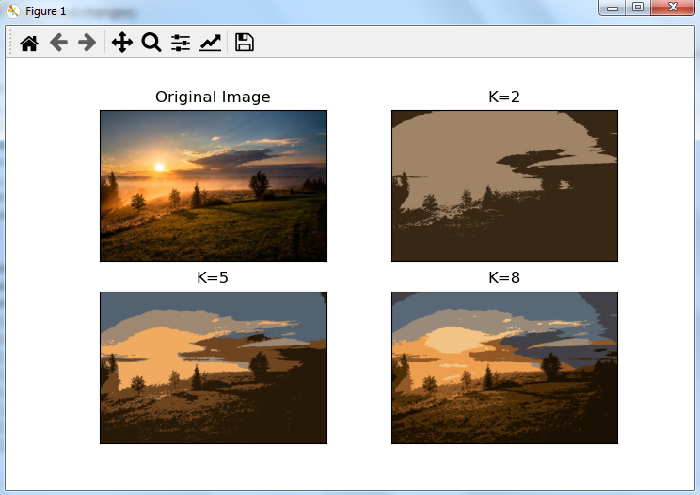
Notice the differences of colors present in different output images. The higher K value is closer to the original image.

3K+ Views
