
 Data Structure
 Networking
 RDBMS
RDBMS Operating System
 Java
Java MS Excel
 iOS
iOS HTML
HTML CSS
CSS Android
 Python
 C Programming
 C++
C++ C#
C# MongoDB
 MySQL
MySQL Javascript
 PHP
PHP
- Selected Reading
- UPSC IAS Exams Notes
- Developer's Best Practices
- Questions and Answers
- Effective Resume Writing
- HR Interview Questions
- Computer Glossary
- Who is Who
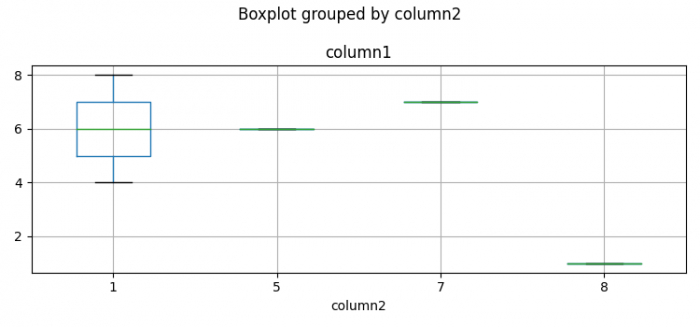
Boxplot stratified by column in Python Pandas
To create a boxplot stratified by column in Python class, we can take the following steps −
Steps
Set the figure size and adjust the padding between and around the subplots.
Create a Pandas data frame of two-dimensional, size-mutable, potentially heterogeneous tabular data.
Compute the histogram of a set of data.
Create a boxplot startified by column.
To display the figure, use show() method.
Example
import pandas as pd
import numpy as np
from matplotlib import pyplot as plt

# Set the figure size
plt.rcParams["figure.figsize"] = [7.50, 3.50]
plt.rcParams["figure.autolayout"] = True

# Pandas dataframe
df = pd.DataFrame({"column1": [4, 6, 7, 1, 8], "column2": [1, 5, 7, 8, 1]})

# Compute the histogram
_, breaks = np.histogram(df.column1, bins=5)

# Create the boxplot
ax = df.boxplot(column='column1', by='column2')

# Display the plot
plt.show()
Output
It will produce the following output −

Updated on: 2022-02-02T10:06:50+05:30
526 Views

Advertisements