
 Data Structure
 Networking
 RDBMS
RDBMS Operating System
 Java
Java MS Excel
 iOS
iOS HTML
HTML CSS
CSS Android
 Python
 C Programming
 C++
C++ C#
C# MongoDB
 MySQL
MySQL Javascript
 PHP
PHP
- Selected Reading
- UPSC IAS Exams Notes
- Developer's Best Practices
- Questions and Answers
- Effective Resume Writing
- HR Interview Questions
- Computer Glossary
- Who is Who
Automatically setting Y-axis limits for a bar graph using Matplotlib
To set Y-axis limit, we can use ylim() method and put maximum and minimum limit values.
Steps
- Set the figure size and adjust the padding between and around the subplots.
- Create two lists for data points.
- Make two variables for max and min values for Y-axis.
- Use ylim() method to limit the Y-axis range.
- Use bar() method to plot the bars.
- To display the figure, use show() method.
Example
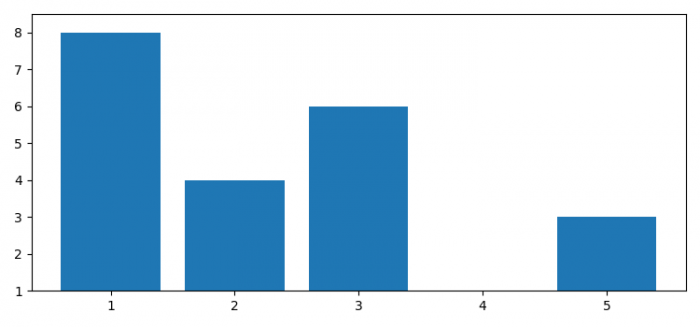
from matplotlib import pyplot as plt

plt.rcParams["figure.figsize"] = [7.50, 3.50]
plt.rcParams["figure.autolayout"] = True
x = [1, 2, 3, 4, 5]
y = [8, 4, 6, 1, 3]
max_y_lim = max(y) + .5
min_y_lim = min(y)
plt.ylim(min_y_lim, max_y_lim)
plt.bar(x, y)
plt.show()
Output

Updated on: 2021-06-02T08:00:21+05:30
9K+ Views

Advertisements