
 Data Structure
 Networking
 RDBMS
RDBMS Operating System
 Java
Java MS Excel
 iOS
iOS HTML
HTML CSS
CSS Android
 Python
 C Programming
 C++
C++ C#
C# MongoDB
 MySQL
MySQL Javascript
 PHP
PHP
- Selected Reading
- UPSC IAS Exams Notes
- Developer's Best Practices
- Questions and Answers
- Effective Resume Writing
- HR Interview Questions
- Computer Glossary
- Who is Who
Adding a data table to the figure using Python
In this article, we will learn how to add a data table to the figure using Python.
Although matplotlib is primarily a plotting library, it also assists us with minor tasks when making a chart, such as having a nice data table alongside our attractive visuals.
It is critical to understand why we are adding a table to a plot. The primary goal of plotting data visually is to clarify the otherwise incomprehensible (or barely understandable) data values. Now we want to add the data back in. It is not advisable to just put a large table with values beneath the chart.
However, properly chosen, perhaps summed, or highlighted values from the entire, charted dataset might identify essential areas of the chart or highlight the important values for those places where the exact value (for eg, yearly sales in USD) is important (even required).
Plotting a Map with a Data Table
Algorithm (Steps)
Following are the Algorithms/steps to be followed to perform the desired task. ?
Use the import keyword to import the pylab of matplotlib and numpy modules.
Create a new figure using the figure() function(used to creates a new figure) of pylab module
gca() function(gets or creates the current Axes object on the current figure matching the specified keyword args)
Create a variable to store a list of column labels by giving some random values.
Create another variable to store the list of row labels by giving some random values.
Create another variable to store the list of values of a table by giving some random values.
Create another variable to store the list of colors of a row by giving some random values.
Use the table() function to create a table using by assigning the above-given table values, widths, row, column labels, row colors, and locations to be placed as arguments to it.
Use the plot() function to plot the graph.
Use the show() function to display the plot.
Example
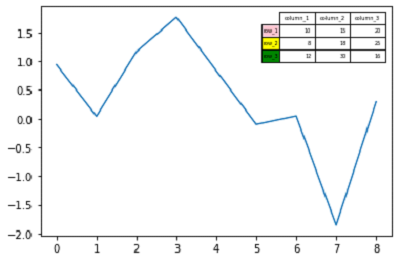
The following program displays the plot by adding a data table to it ?
# importing pylab of matplotlib, NumPy modules
import matplotlib.pylab as plt
import numpy as np

# creating a new figure
plt.figure()

# Find the most recent instance of matplotlib.axes.Axes on the current figure
ax = plt.gca()
# Get some random number
y = np.random.randn(9)

# list of column labels
columnLabels = ['column_1','column_2','column_3']
# list of row labels
rowLabels = ['row_1','row_2','row_3']
# list of values of a table
tableValues = [[10, 15, 20], [8, 18, 25], [12, 30, 16]]
# list of colors of a row
rowColors = ['pink', 'yellow', 'green']

# creating a table using table() function by assigning table values,
# widths, above given row, column labels, row colors, location to be placed
# as arguments to it.
my_table = plt.table(cellText=tableValues,
   colWidths=[0.1] * 3,
   rowLabels=rowLabels,
   colLabels=columnLabels,
   rowColours=rowColors,
   loc='upper right')

# plotting a plot
plt.plot(y)

# displaying the plot
plt.show()
Output
On execution, the above program will generate the following output ?
How does it work?
We create a table of cells with plt.table() function and add it to the current axes. Row and column headings are optional in the table. Patches or text can be found in each table cell. The table's column widths and row heights can be customized. The return value is a list of objects (text, line, and patch instances) that make up the table.
Syntax for plt.table() function
table(cellText=None, cellColours=None,
   cellLoc='right', colWidths=None,
   rowLabels=None, rowColours=None, rowLoc='left',
   colLabels=None, colColours=None, colLoc='center',
   loc='bottom', bbox=None)
The function creates and returns the matplotlib.table.Table instance. This is common with matplotlib; there is only one way to add the table to the figure. The object-oriented interface can be accessed directly. We may make use of matplotlib.table.
We may use the matplotlib.table.Table class directly to fine-tune our table before adding it to our axes instance using add_table() function.
Conclusion
In this article, we learned how to use Python's plt.table() method to add a data table to a figure. To better understand how this table() method operates, we also studied its syntax.

2K+ Views
