
 Data Structure
 Networking
 RDBMS
RDBMS Operating System
 Java
Java MS Excel
 iOS
iOS HTML
HTML CSS
CSS Android
 Python
 C Programming
 C++
C++ C#
C# MongoDB
 MySQL
MySQL Javascript
 PHP
PHP
- Selected Reading
- UPSC IAS Exams Notes
- Developer's Best Practices
- Questions and Answers
- Effective Resume Writing
- HR Interview Questions
- Computer Glossary
- Who is Who
Adding a Chartsheet in an excel sheet using Python XlsxWriter module
In addition to python’s own libraries, there are many external libraries created by individual authors which do a great job of creating additional features in python. Xlsx library is one such library which not only creates excel files containing data from python programs but also creates charts.
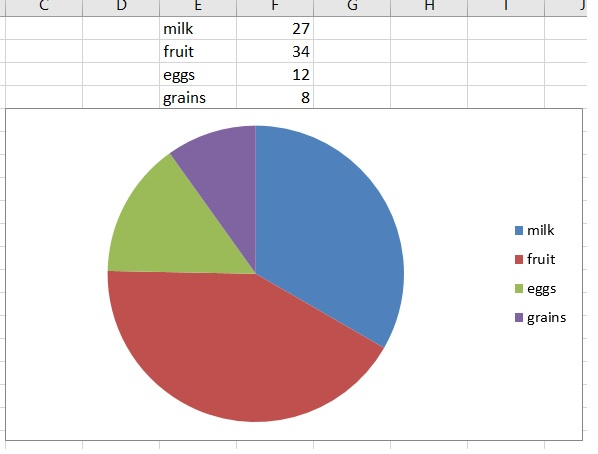
Creating Pie Chart
In the below example we will create a pie chart using the xlsxwriter writer. Here we first define a workbook then add a worksheet to it in the next step we define the data and decide on the columns where the data will be stored in an excel file based on those columns we define a pie chart and again are the chat to a specific location in the worksheet.
Example
import xlsxwriter

workbook = xlsxwriter.Workbook('pie_chart_example.xlsx')
worksheet = workbook.add_worksheet()

# Add the data to be plotted.
data = [
   ['milk', 'fruit', 'eggs', 'grains'],
   [27,34,12,8]
]
worksheet.write_column('A1', data[0])
worksheet.write_column('B1', data[1])

# Create a new chart object.
chart = workbook.add_chart({'type': 'pie'})

# Add a series to the chart.
chart.add_series({
   'categories': '=Sheet1!$A$1:$A$4',
   'values': '=Sheet1!$B$1:$B$4'
})

# Insert the chart into the worksheet at a specific position
worksheet.insert_chart('C5', chart)

workbook.close()
Running the above code gives us the following result

Updated on: 2020-01-02T09:34:40+05:30
511 Views

Advertisements